
What Is Fleet Performance Management?
Fleet performance management is the process of measuring how vehicles, drivers, and operations perform using structured data. It helps businesses understand whether daily fleet activities align with cost, safety, and productivity goals.
Real-time inputs from GPS tracking, telematics systems, and maintenance records provide visibility into how vehicles are used on the road. Fleet managers rely on this data to detect inefficiencies, control expenses, and maintain consistent service delivery.
Performance tracking supports informed decisions across dispatch, maintenance, and driver management. Key performance indicators provide a structured framework to evaluate results and improve fleet operations over time.
Why Are KPIs Important in Fleet Management?
KPIs provide a measurable way to evaluate how fleet operations perform across cost, safety, and productivity.
- Performance Visibility: Real-time metrics show how vehicles, drivers, and routes perform during daily operations. Access to live data helps managers detect delays, route deviations, and underutilized assets during active operations.
- Cost Control: Fuel usage, maintenance expenses, and operational costs become easier to track with defined indicators. Detailed cost insights reveal spending patterns and highlight areas that require immediate attention.
- Data Decisions: KPI-driven insights guide planning across dispatch, routing, and maintenance scheduling. Operational decisions rely on actual performance trends rather than assumptions or manual estimates.
- Driver Accountability: Behavior tracking highlights driving patterns such as speeding or harsh braking. Recorded events support driver evaluation, policy enforcement, and long-term safety monitoring.
- Operational Flow: Route planning, idle time monitoring, and vehicle usage depend on performance tracking across the fleet. Coordinated data usage keeps dispatch, drivers, and vehicles aligned with operational targets.
What Are the Top 8 Fleet Performance KPIs?
Fleet performance becomes easier to evaluate as core KPIs are tied to cost, vehicle activity, driver conduct, and service output.
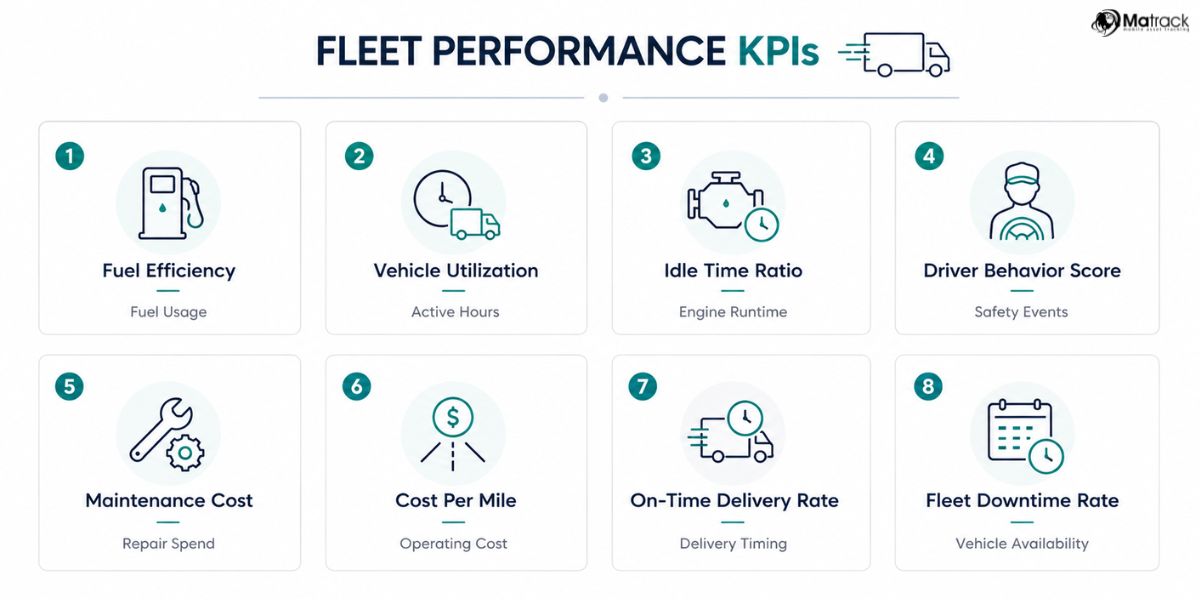
1. Fuel Efficiency
Fuel efficiency connects distance covered with fuel consumed across daily fleet operations. Fuel spend remains one of the largest operating costs in logistics, making this KPI critical for margin control.
Mileage logs, telematics reports, and fuel card data help uncover variation across similar routes and vehicle groups. Idle duration, road conditions, engine health, and driving behavior often explain why consumption starts to rise.
Route-level review gives fleet managers a practical way to compare performance under similar workloads. Recurring variance across trips usually points to waste tied to dispatch planning, vehicle condition, or driver habits.
2. Vehicle Utilization Rate
Vehicle utilization rate compares active service hours with total available time across fleet assets. Asset value depends on productive use, since parked vehicles still add ownership, insurance, and maintenance expense.
Dispatch records, trip history, and service schedules help reveal whether workload is spread evenly across available units. Uneven allocation often leaves part of the fleet underused while a smaller group absorbs most of the daily demand.
Shift-level and route-level analysis gives fleet managers a clearer basis for capacity planning. Persistent imbalance usually signals issues tied to scheduling, route assignment, or overall fleet size.
3. Idle Time Ratio
Idle time ratio captures engine runtime during stationary periods across operational hours. Extended engine activity without movement leads to unnecessary fuel burn and added mechanical strain.
Engine status signals, stop-duration logs, and ignition data highlight where stationary runtime builds up during loading, waiting, or congestion-heavy zones. High accumulation in specific locations often indicates inefficiencies in stop coordination or route design.
Location-based analysis gives operations teams a clearer view of delay sources tied to dispatch timing or site handling. Repeated buildup around similar stops often points to process gaps rather than unavoidable delays.
4. Driver Behavior Score
Driver behavior score combines events such as speeding, harsh braking, sudden acceleration, and aggressive cornering into a single safety-focused metric. Risk exposure increases as these events accumulate across daily driving activity.
Event logs, motion sensors, and onboard diagnostics capture driving patterns across different road conditions and duty cycles. Frequent violations in specific areas or time windows often indicate gaps in training or policy enforcement.
Performance review at driver level helps identify individuals who require coaching or monitoring. Repeated high-risk patterns often translate into higher insurance claims, repair costs, and compliance concerns.
5. Maintenance Cost per Vehicle
Maintenance cost per vehicle reflects total spending required to keep individual units roadworthy over a defined period. Repair burden often concentrates on specific units rather than spreading evenly across the fleet.
Service invoices, workshop records, parts replacement history, and labor hours reveal which units demand higher upkeep. Frequent breakdowns or repeated repairs often indicate aging assets, heavy-duty cycles, or delayed preventive servicing.
Cost comparison at unit level helps operations teams decide whether continued repair is viable or replacement is justified. Rising spend over time often signals declining asset reliability and reduced operational value.
6. Cost per Mile
Cost per mile relates total operating expenses to distance covered over a reporting period. Financial performance becomes easier to interpret once spending is aligned with movement.
Expense categories such as fuel, wages, servicing, insurance, and depreciation contribute to this figure in different proportions. Variation often appears across vehicle classes, service types, and delivery structures.
Breakdown by expense source helps managers identify which component is driving the increase. Movement in this KPI often reflects shifts in usage intensity, repair frequency, or operational planning.
7. On-Time Delivery Rate
On-time delivery rate compares completed arrivals against promised service or delivery windows. Customer satisfaction, contract adherence, and service credibility often depend on this result.
Planned schedules, actual arrival timestamps, and dispatch timelines reveal where delays build across territories, time slots, or stop sequences. Late completion in the same areas often points to weak route planning, overloaded schedules, or vehicle availability issues.
Review per service zone gives fleet managers a sharper view of timing gaps tied to local traffic exposure or stop density. Declining delivery performance often affects retention, service quality, and daily workload balance.
8. Fleet Downtime Rate
Fleet downtime rate captures hours lost to servicing, inspections, repairs, or unexpected breakdowns across active units. Reduced availability limits route coverage and puts pressure on daily scheduling.
Maintenance history, garage turnaround time, and unit availability logs reveal where outages begin to accumulate. Longer repair cycles or repeated failures often indicate weak service planning, aging equipment, or parts-related delays.
Downtime review at fleet level helps managers understand how lost hours affect assignment capacity and workload distribution. Higher unavailability often leads to missed trips, delayed service, and lower asset output.
How Are Fleet KPIs Measured and Tracked?
Fleet KPIs are tracked through a structured flow of data collection, processing, and performance reporting across daily operations.
Data Collection
Data begins at the vehicle level through telematics devices, GPS trackers, and onboard sensors. Movement, engine activity, speed, and idle patterns are captured continuously during trips and stored for further use.
Data Integration
Collected data from vehicles, fuel logs, maintenance records, and dispatch systems is combined into a single platform. Integration allows different data points to connect, creating a complete operational view instead of isolated records.
KPI Calculation
Raw data is translated into meaningful indicators such as fuel usage trends, utilization patterns, and delivery performance. Calculations happen in the background based on distance, time, cost inputs, and driver activity.
Dashboard Reporting
Processed data is displayed through dashboards that present KPIs in charts, summaries, and trend lines. Visual reports help managers review performance across vehicles, routes, and time periods without manual analysis.
Performance Monitoring
Ongoing tracking highlights changes in cost, usage, and operational behavior over time. Trend comparison across days, weeks, or months helps identify where performance shifts begin and where action is required.
How Matrack Telematics Helps To Track Fleet Performance Management KPIs?
Matrack telematics provides real-time data, alerts, and reporting tools that connect fleet activity with measurable KPI performance.
- Real-Time Tracking: Live GPS tracking shows vehicle location, movement, and route activity throughout the day. Continuous visibility helps link trip data with fuel usage, delivery timing, and utilization patterns.
- Driver Monitoring: Driving events such as harsh braking, speeding, and acceleration are recorded during trips. Behavior insights support safety tracking and connect directly with driver performance scores.
- Fuel Insights: Fuel usage patterns become visible through integrated tracking and fuel management tools. Spending trends, refueling behavior, and route-based consumption help identify cost variations.
- Idle Alerts: Engine activity and idle duration are tracked across routes and stops. Alerts highlight extended idle periods so unnecessary fuel burn can be reduced.
- Maintenance Tracking: Vehicle activity, mileage, and usage patterns support maintenance scheduling and cost tracking. Service records and alerts help monitor vehicle condition and downtime patterns.
- Performance Reports: Centralized dashboards organize fleet data into structured KPI reports. Managers can review trends across cost, usage, safety, and delivery performance in one place.
Frequently Asked Questions
What is the most important KPI in fleet performance management?
No single KPI applies to every fleet since operational goals vary by industry and service model. Cost per mile, fuel efficiency, and vehicle utilization often receive priority due to their direct impact on expense and asset usage.
How often should fleet KPIs be reviewed?
Review frequency depends on the type of metric and operational intensity. Safety and behavior data are often checked daily, while cost and maintenance indicators are reviewed weekly or monthly.
What is a good vehicle utilization rate?
Acceptable utilization levels vary based on fleet size, workload type, and service demand. Balanced usage across assets is more important than pushing maximum activity on a few vehicles.
How can fleet managers reduce fuel costs?
Fuel cost reduction usually starts with monitoring consumption trends and identifying inefficiencies tied to driving patterns or idle time. Route planning, driver training, and vehicle maintenance also play a key role in controlling usage.
Why is driver behavior tracking important?
Driver behavior directly affects safety, fuel usage, and vehicle condition. Monitoring driving patterns helps reduce risk exposure and supports performance improvement through targeted coaching.
What causes high fleet downtime?
Frequent breakdowns, delayed servicing, and aging vehicles often contribute to higher downtime. Parts availability and repair turnaround time also influence how long vehicles remain out of service.
How does telematics support KPI tracking?
Telematics systems provide real-time data on vehicle activity, location, and driver behavior. Centralized dashboards make it easier to monitor performance trends and respond to operational issues quickly.